Beyond the Numbers : A Deeper Look at Canada's Business Activity
Share Now:
Canada’s post-pandemic economic trajectory has entered what appears to be a phase of balance.

Between January 2023 and March 2025, the number of active businesses in the country remained within a tight band of 930,000 to 940,000. Business openings and closures occurred at almost equal rates, producing an image of a steady and healthy market. However, this seeming stability may obscure deeper concerns.
This report critically examines the business activity data provided by Statistics Canada (Table 33-10-0270- 01) Statistics Canada , with a focus on trends in business openings, closures, continuations, and reopenings, especially as segmented by business size.
It also considers how global macroeconomic factors— such as trade disruptions, geopolitical conflict, and inflation—interact with the Canadian domestic business landscape. Ultimately, this paper argues that “stability” may mask stagnation and fragility in key segments of the economy.


Navneet Garg
President and Co-founder

Chhavi Tyagi
Data Analyst

Shruti Gupta
Data Analyst
Spikes in openings were observed in March and December 2024, likely tied to fiscal year cycles and seasonal business opportunities (e.g., retail).
On the other hand, closures peaked in November and December 2024, possibly reflecting strategic year-end exits, costcutting decisions, or performance-based shutdowns.
Apparent Stability in Active Business Numbers

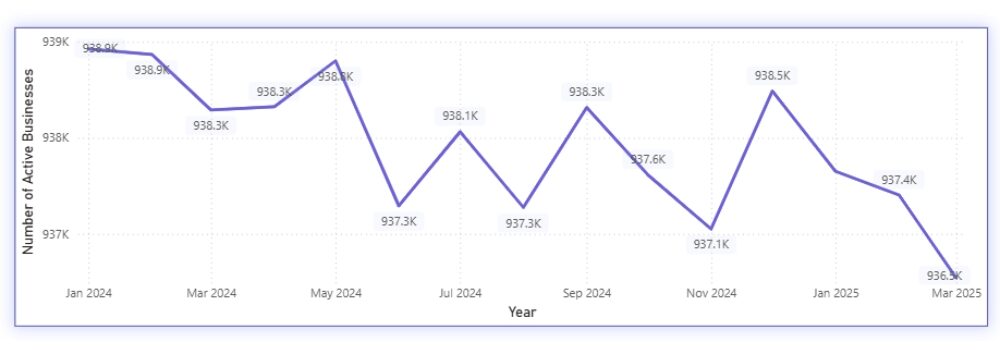
From mid-2023 onward, the number of active businesses in Canada hovered around 936,000 to 938,000—a remarkably narrow range for two years. Minor seasonal fluctuations were observed, typically recovering within one to two months. Superficially, this suggests a resilient economy capable of absorbing shocks.
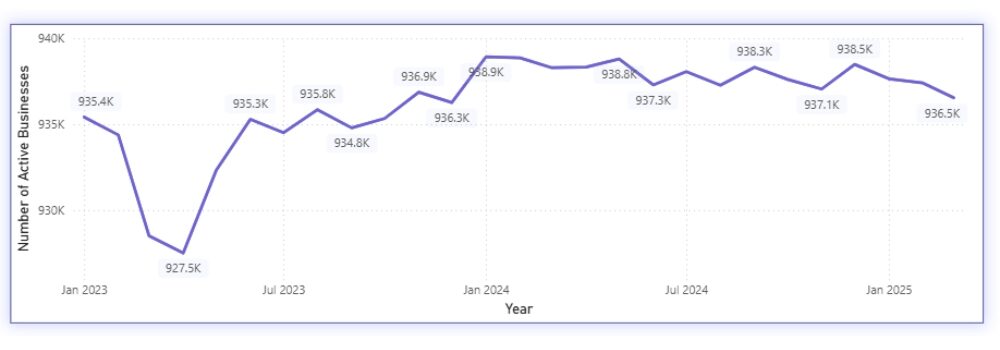
However, the net growth rate of active businesses slowed significantly. By Q1 2025, monthly changes were either flat or negative. In March 2025, for example, Statistics Canada reported a 0.1% decline in active businesses.
If the number of new firms entering the market merely offsets those that fail or shut down, the business ecosystem may remain stagnant. Such a pattern could indicate rising barriers to scale and long-term sustainability, especially in the face of global uncertainty.
Openings vs. Closures: The Churn Story
Throughout the period from January 2023 to March 2025, monthly business openings typically ranged from 44,000 to 48,000, while closures fluctuated between 43,000 and 47,000.
This close margin reflects a natural churn, but one that leans precariously toward balance rather than growth.
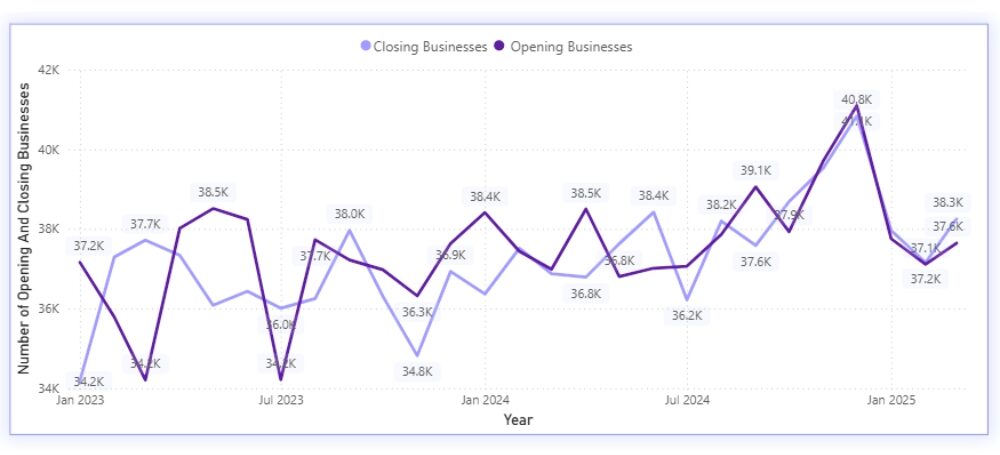
Spikes in openings were observed in March and December 2024, likely tied to fiscal year cycles and seasonal business opportunities (e.g., retail).
On the other hand, closures peaked in November and December 2024, possibly reflecting strategic year-end exits, costcutting decisions, or performance-based shutdowns.
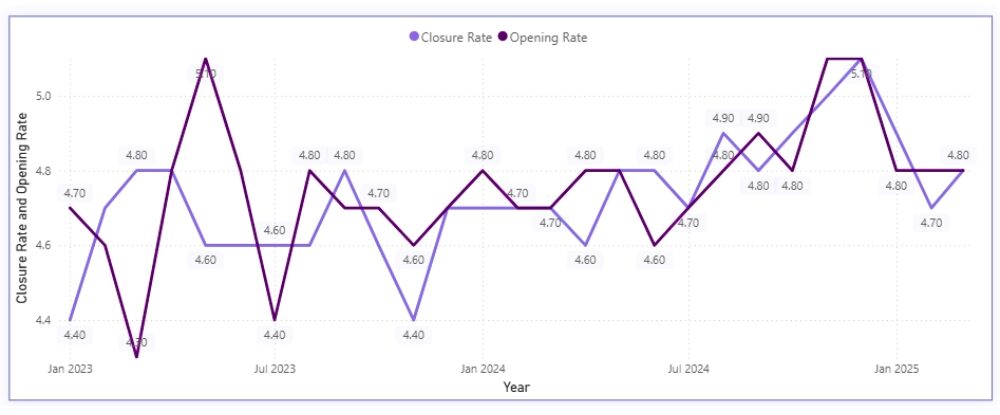
By March 2025, both the opening and closure rates reached 4.8%, resulting in a slight net decline in business activity. This crossover moment highlights the fragility of the current business cycle. The slightest economic pressure—such as a rate hike or trade disruption—could easily tip the balance toward contraction.
Business Size Analysis: Micro-Businesses Dominate
Perhaps the most important insight from the dataset is the overwhelming dominance of microbusinesses (1–4 employees) among active businesses, as well as in both the opening and closing.
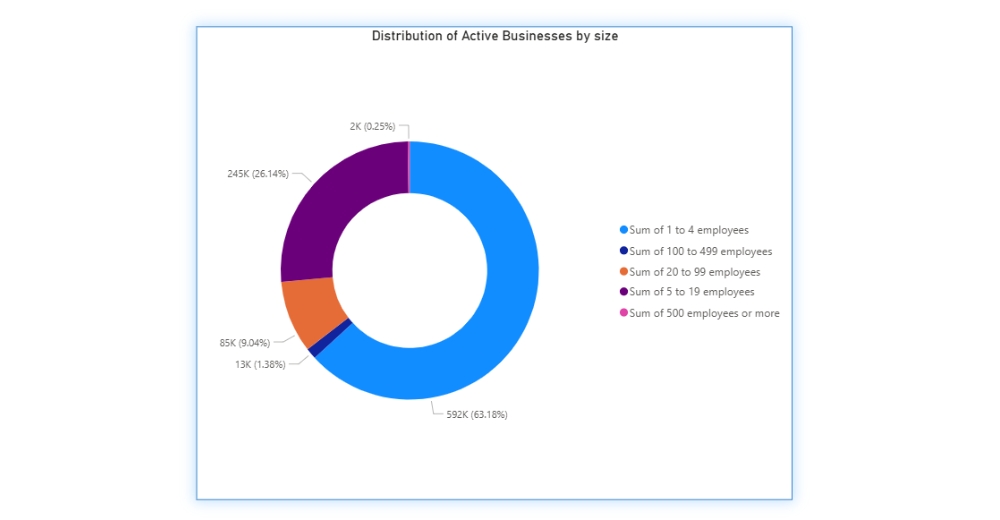
- In March 2025, 86% of new business entries came from this category.
- Simultaneously, 84% of all closures were also microbusinesses.
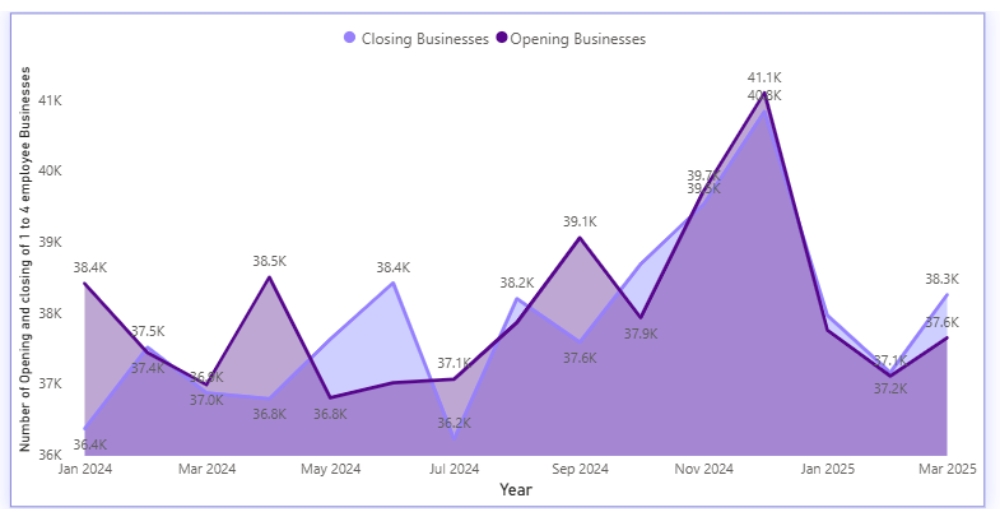
This dynamic suggests that while small firms are actively entering the market, many are not surviving long enough to transition into medium-sized or larger enterprises.
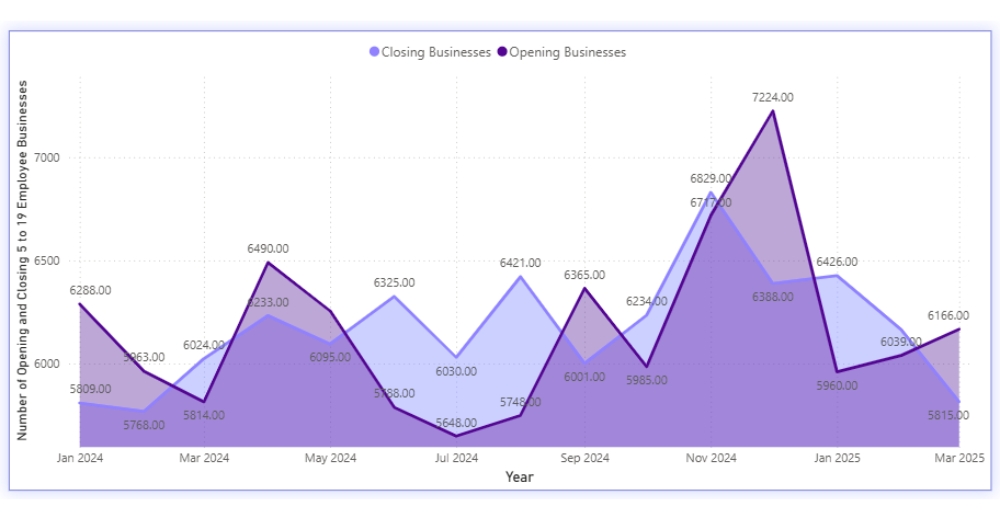
Businesses with 5–19 employees made up only 13–14% of activity, while those with 20 or more employees represented less than 2% of openings or closures. This stagnation at the mid-size level is troubling.
Medium-sized firms are typically responsible for scaling innovation, generating stable jobs, and absorbing economic shocks. Their limited activity suggests that Canada’s business system is not favoring sustainable growth.
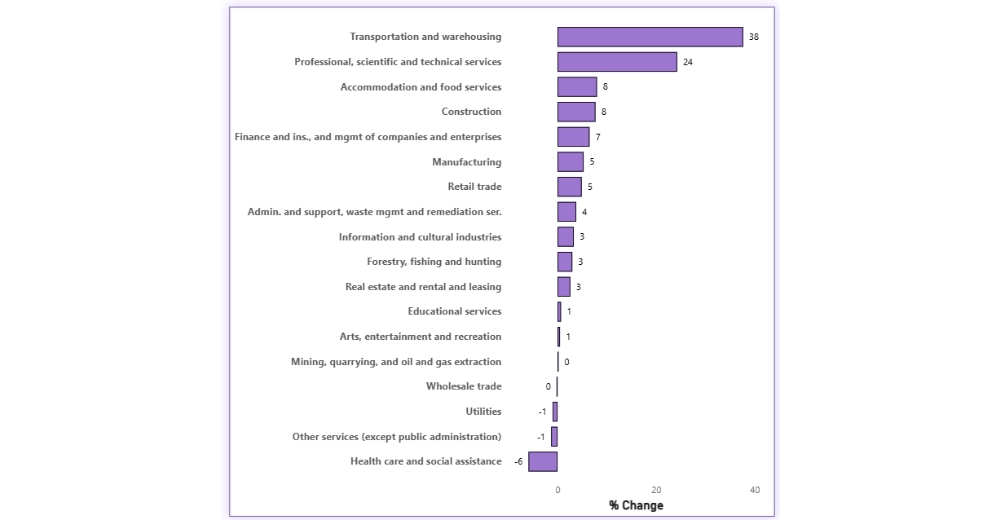
Sectoral Shifts: Uneven Pressures Across Industries
Not all sectors have performed equally. The following industries experienced above-average closure rates in late 2024 and early 2025:
- Construction: Hit by high borrowing costs and delayed project approvals.
- Retail: Struggled with inflation-impacted consumer demand and rising input prices.
- Professional Services: Vulnerable to labor shortages and contract volatility.
- Transportation & Warehousing: Affected by fuel costs and global logistics disruptions.
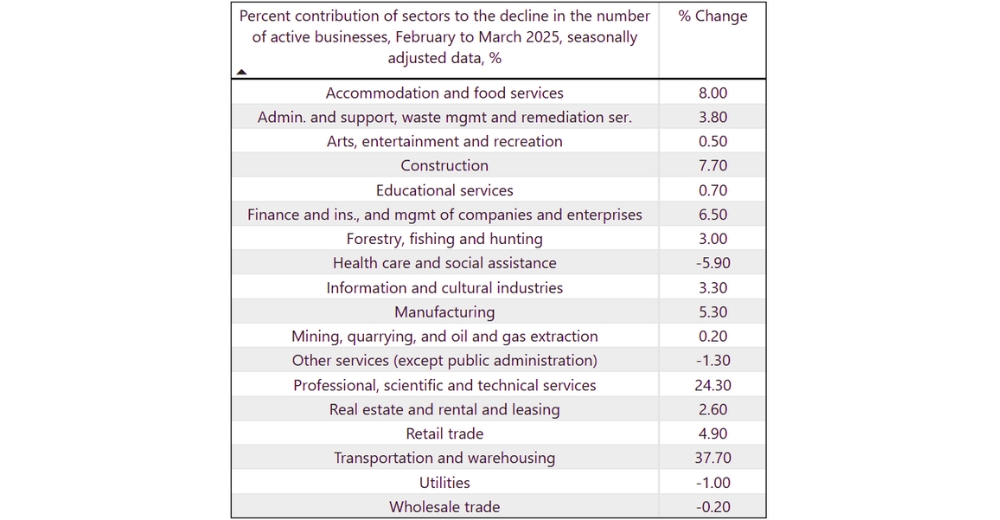

These sectors are either highly cyclical or exposed to external cost pressures. Their performance may serve as a barometer for broader macroeconomic vulnerabilities.
The government’s data also shows that reopening rates have decreased slightly in Q1 2025, suggesting that some temporary closures may be evolving into permanent exits.
Deeper Dive: Trends for Each Sector
 This section analyzes monthly trends in active businesses across key Canadian sectors from January 2023 to early 2025
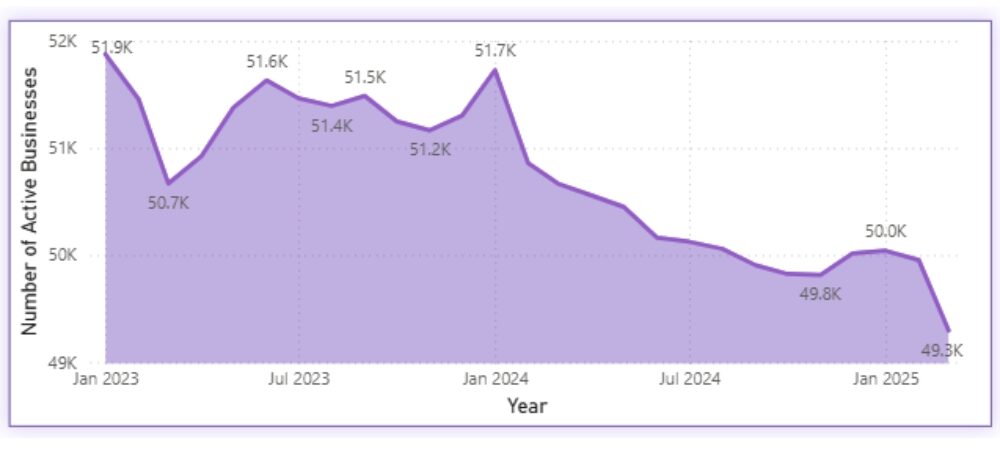
A. Transportation and Warehousing: The Transportation and Warehousing sector began 2023 with a moderate number of active businesses, peaking at 51.9K in the early months.
However, a noticeable decline followed, with figures fluctuating slightly throughout the year but remaining largely stagnant around the 51.2K–51.6K range.
A temporary high in early 2024, at 51.7K, gave way to a pronounced downward trend that continued steadily throughout 2024. By early 2025, the number had dropped significantly to 49.3K,
signaling a sustained contraction likely influenced by rising fuel costs, logistical bottlenecks, or shifts in demand for freight and delivery services.
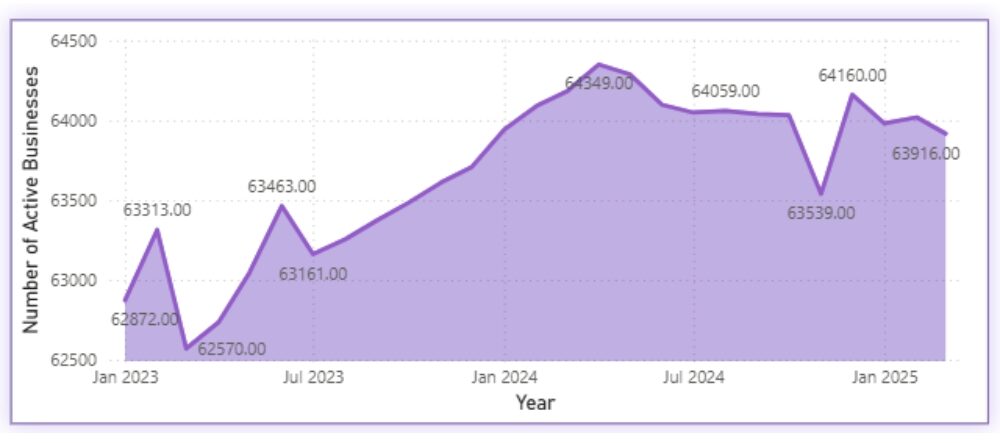
B. Accommodation and Food Services: This sector demonstrated relatively steady growth over the two years. Starting at around 62.8K active businesses in early 2023, the industry experienced a brief dip to 62.5K but quickly regained momentum.
Throughout 2023 and into 2024, the number of active businesses climbed gradually, reaching a high of 64.3K in early 2024. Despite minor dips mid-2024 and early 2025,
the sector ended strong with 63.9K businesses.The resilience and overall upward trend suggest recovery from prior pandemic-related challenges,
possibly supported by increased tourism, dining demand, and adaptation to hybrid service models (e.g., delivery and outdoor dining).
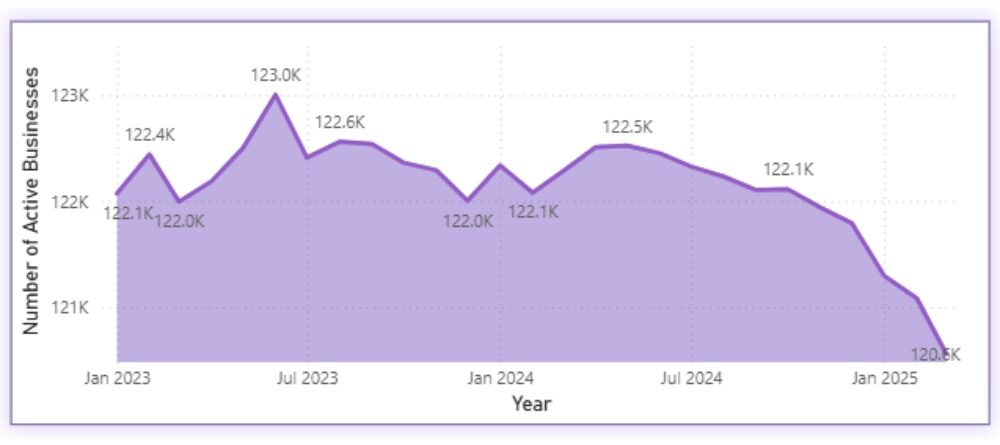
C. Professional, Scientific, and Technical Services:
The professional services sector held relatively steady throughout most of 2023, maintaining between 122.0K and 123.0K active businesses.
A moderate peak in mid-2023 (123.0K) was followed by a slow and steady decline that extended through late 2024. By January 2025, the number of active businesses had dropped to 120.6K
The gradual downturn, particularly in late 2024 and early 2025, could reflect tightening budgets in client organizations, reduced demand for consulting and technical services, or delayed effects of broader economic uncertainty on professional firms.
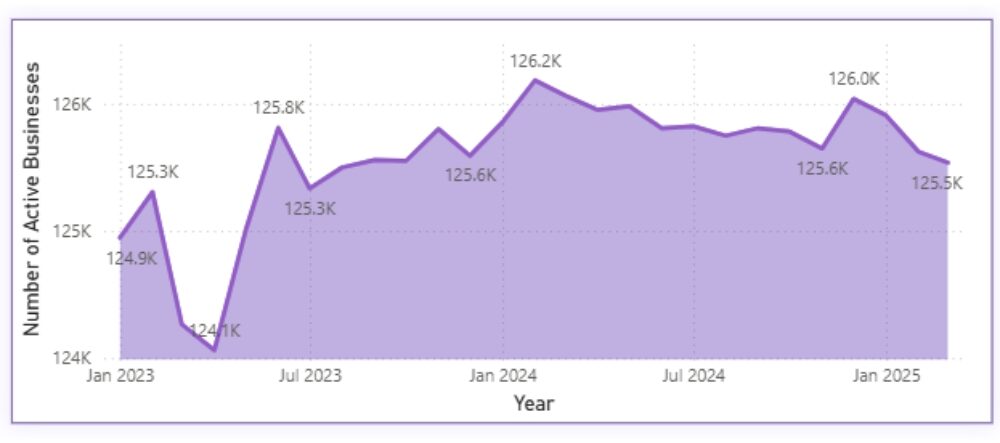
D. Construction: Construction experienced one of the most dynamic patterns among all sectors. Beginning with 124.9K active businesses in early 2023, the industry saw a steep dip to 124.1K mid-year, –
Despite these fluctuations, the sector sustained relative strength, closing early 2025 with 125.5K active businesses. The sector’s volatility may reflect seasonal project cycles,-
followed by a swift recovery and multiple peaks, reaching 125.8K in mid-2023 and then 126.2K in early 2024.-
material cost variability, and sensitivity to interest rate changes impacting residential and commercial development.
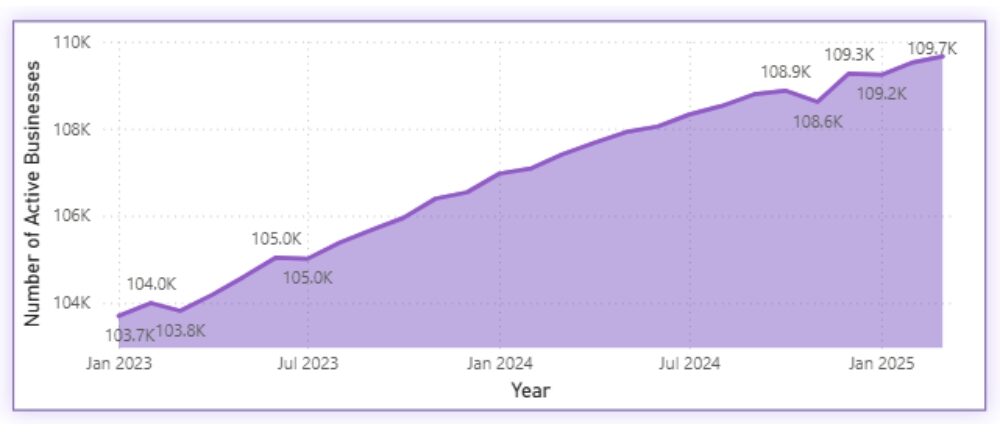
E. Health Care: Health Care displayed a consistent and robust upward trend, starting at 103.7K in January 2023 and climbing steadily throughout the period.
By mid-2023, the count reached 105K and continued rising each quarter to reach 109.7K by early 2025.
This growth trajectory reflects enduring demand driven by an aging population, ongoing public health needs, and expansion in home care and mental health services.
The sector’s stability and positive momentum mark it as one of the most resilient across the board.
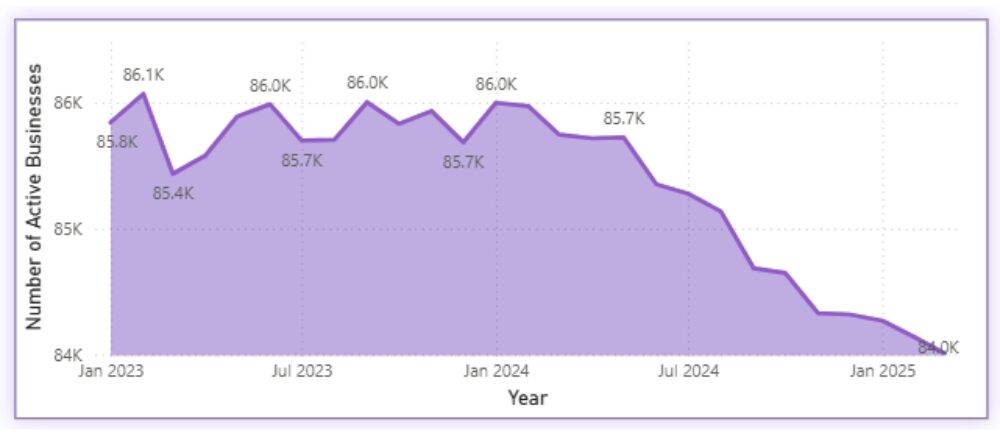
F. Retail Trade: The Retail Trade sector exhibited early stability in 2023, with business numbers hovering between 85.4K and 86.1K.
However, from mid-2024 onwards, the sector faced a marked decline. By early 2025, active businesses had fallen sharply to 84.0K — a clear indicator of contraction.
This downward movement may be tied to sustained consumer shifts toward ecommerce, high inflation reducing discretionary spending,-
and growing operational pressures on small and mid-sized retailers. The consistent drop suggests deeper structural changes within the sector.
Insight: Cross-Sector Trends in Active Businesses (Jan 2023 – Mar 2025)
The data across six major sectors reveals a mixed picture of growth, resilience, and contraction within Canada’s business landscape over the past two years.

- Sectors Showing Sustained Growth: Health Care stands out with continuous and stable growth, adding nearly 6K active businesses from January 2023 to early 2025. This expansion reflects demographic pressures and growing demand for healthcare services. Similarly, the Accommodation and Food Services sector shows a gradual recovery, likely driven by easing post-pandemic constraints and renewed consumer activity.
- Sectors Showing Sustained Growth: Health Care stands out with continuous and stable growth, adding nearly 6K active businesses from January 2023 to early 2025. This expansion reflects demographic pressures and growing demand for healthcare services. Similarly, the Accommodation and Food Services sector shows a gradual recovery, likely driven by easing post-pandemic constraints and renewed consumer activity.
- Volatile but Stable Sectors: The Construction sector showed significant short-term fluctuations yet maintained overall strength with a marginal net gain over the two years. – This pattern points to a sector that is highly sensitive to seasonal cycles and policy shifts like interest rate changes yet remains structurally important.
- Sector in Decline: Retail Trade emerged as the most clearly declining sector, with a steady downward trajectory that began mid-2024 and culminated in a notable loss of over 2K active businesses.- This trend may signal deeper disruptions due to digital transformation, changing consumer habits, and cost pressures in brick-and-mortar operations.
Overall Implication:
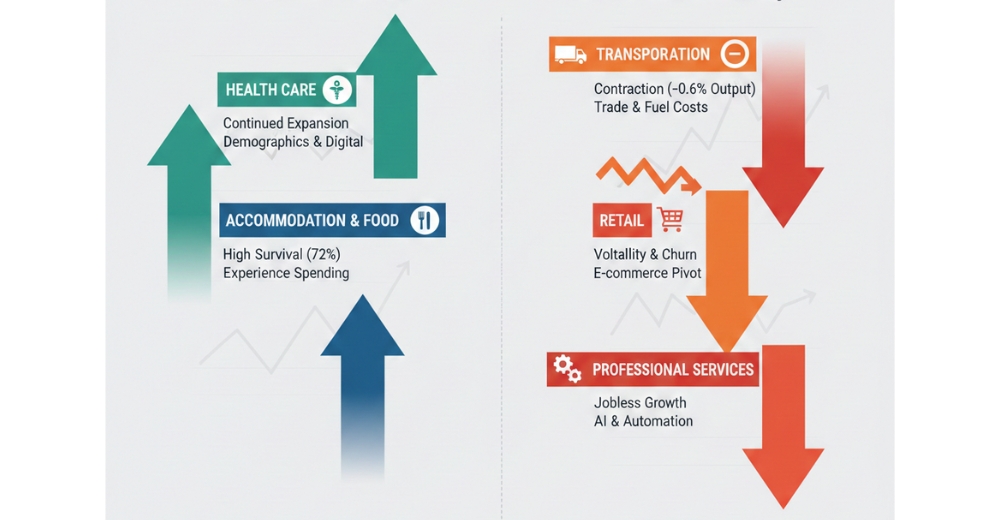
While certain essential service sectors (Health Care, Accommodation & Food) are growing or stabilizing, others — particularly Transportation, Retail, and Professional Services — are showing signs of contraction or volatility.
These patterns underscore the importance of sector-specific policy interventions and highlight were structural transformation, or support may be needed most.
Global Economic Context and External Threats
From a global perspective, several external forces pose major risks to Canada’s business continuity, particularly for export-facing and energy-intensive industries:
- Tariff and Trade Risks: Potential shifts in U.S. trade policy could reintroduce tariffs on Canadian goods, especially in agriculture, energy, and manufacturing.
- Geopolitical Conflict: Ongoing wars in Ukraine and the Middle East continue to disrupt global energy and commodity flows, impacting pricing and supply chains.
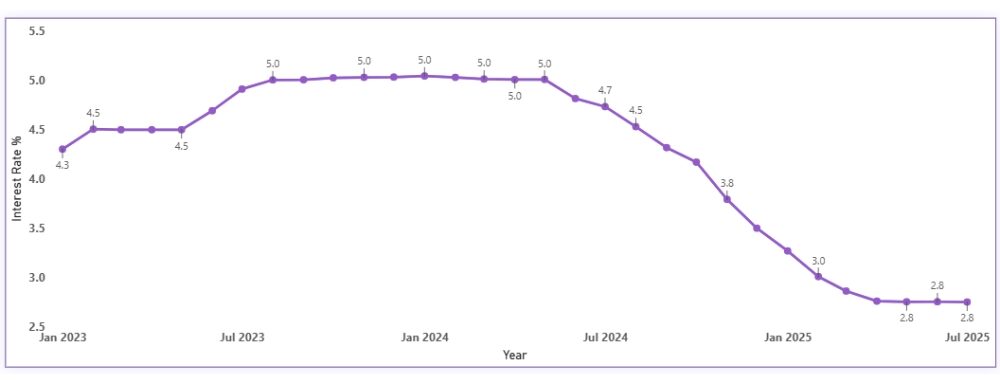
- Interest Rates: The Bank of Canada’s benchmark rate has remained elevated (around 5%) throughout much of this period, squeezing access to capital and delaying investment
Inflation: Although slightly cooling, core input costs remain high, putting pressure on small businesses that cannot easily pass on expenses to customers.
Each of these factors heightens the vulnerability of small and medium-sized businesses, especially those in exposed sectors like logistics, food services, or construction.
Regional and Structural Vulnerabilities

While national averages suggest balance, regional disparities persist. Census metropolitan areas (CMAs) with heavy concentrations in single industries (e.g., oil and gas in Alberta, tech in Ontario) show sharper swings in business entries and exits.
Additionally, rural and semi-urban regions with higher dependence on small firms are more sensitive to economic shocks.
Temporary closures in these regions—often due to labor shortages or seasonality—are more likely to turn permanent without adequate support or transition assistance.
The data also raises structural concerns about succession planning and innovation. Many small firms operate as sole proprietorships without clear continuity strategies.
Conclusion
Between January 2023 and March 2025, Canada’s business landscape presented a deceptively calm picture. But as this deeper analysis shows, the country’s.
economic engine is powered disproportionately by vulnerable micro-businessesThe slow pace of scale-up activity, coupled with the rising tide of global and domestic risks, puts this apparent stability at risk.
Now is the time to transform short-term survival into long-term sustainability by addressing the size imbalance, sectoral fragility, and policy gaps that persist beneath the surface.
Without proactive intervention, the ecosystem could tip toward contraction, especially if global pressures intensify.