Transform Data into Strategic Advantage
Share Now:
As digital interactions become increasingly integrated into daily life, data is generated unprecedented pace, Analytics is the process that helps organizations do just that. By examining data in a structured way
Whether through online purchases, Google searches, hospital records, or logistics updates. According to Statista, the amount of data generated globally is expected to reach 181 zettabytes by 2025, up from just 79 zettabytes in 2021 However, businesses can uncover trends, detect problems early, and predict future outcomes. For example, Netflix uses viewing data to suggest content its users are more likely to enjoy while businesses collect massive amounts of this information, raw data alone is not enough.
The real competitive edge comes from turning this data into knowledge resulting in higher engagement. Similarly, Walmart uses analytics to optimize inventory based on customer demand and local buying behavior.
Shruti Gupta
Data Analyst
When used well, analytics becomes a powerful decision-making tool.

It helps organizations improve customer service, reduce costs, avoid risks, and innovate more confidently A report by McKinsey found that data-driven companies are 23 times more likely to acquire customers and 19 times more likely to be profitable (QuantumBlack, 2016).
In a world driven by digital experiences and rapid market shifts, using data wisely isn’t just a technical advantage—it’s a strategic necessity. (IBM, n.d.)
Understanding the Four Ways Organizations Use Data
Organizations typically analyze data through four progressive approaches that transform raw information into strategic insight.
Descriptive analytics helps understand what happened by reviewing historical data and performance metrics. For example, imagine you’re analyzing your company’s data and find there’s a seasonal surge in sales for one of your products: a video game console. Here, descriptive analytics can tell you, “This video game console experiences an increase in sales in October, November, and early December each year.” (Harward, n.d.)
Diagnostic analytics digs deeper to explain why events occurred, uncovering patterns and underlying causes such as a drop in sales or increased churn. Continuing the aforementioned example, you may dig into video game console users’ demographic data and find that they’re between the ages of eight and 18. The customers, however, tend to be between the ages of 35 and 55.
Analysis of customer survey data reveals that one primary motivator for customers to purchase the video game console is to gift it to their children. The spike in sales in the fall and early winter months may be due to the holidays that include gift-giving. the video game console is to gift it to their children. The spike in sales in the fall and early winter months may be due to the holidays that include gift-giving.
Predictive analytics uses trends, algorithms, and statistical models to anticipate what is likely to happen, enabling proactive planning. For instance, knowing that video game console sales have spiked in October, November, and early December every year for the past decade provides you with ample data to predict that the same trend will occur next year. Backed by upward trends in the video game industry, this is a reasonable prediction to make.
This pie chart shows how much businesses rely on each type of analytics. Most companies still focus on understanding the past, but more are moving toward prediction and planning. Source: (Harward, n.d.)
Finally, prescriptive analytics suggests what actions to take by evaluating possible decisions and their projected impact. Rounding out the video game example: What should your team decide to do given the predicted trend in seasonality due to winter gift-giving? Perhaps you decide to run anA/B test with two ads: one that caters to product end users (children) and one targeted to customers (their parents). The data from that test can inform how to capitalize on the seasonal spike and its supposed cause even further. Or, maybe you decide to increase marketing efforts in September with holiday-themed messaging to try to extend the spike into another month. (Harward, n.d.)
Retail : Knowing the Customer Better
Retailers like Nike and Amazon are making the most of data to better understand their customers and improve shopping experiences. They track important customer behaviors, such as which products people look at, what they purchase, and how often they return items. By analyzing this information, they can offer personalized shopping recommendations. For example, if you often buy running shoes,the website might suggest the latest models or offer exclusive discounts on those items. This kind of tailored experience helps customers feel more valued and understood. As a result, they are more likely to make purchases and remain loyal to the brand.
McKinsey highlights that personalizing recommendations can not only increase sales but also strengthen customer loyalty. Personalized marketing strategies can reduce the cost of acquiring new customers by up to 50% and increase overall revenue by 5% to 15%. By utilizing data in this way, retailers can boost both customer satisfaction and their bottom line (Shopify, n.d.)
This bar chart shows how customer purchases increased after brands
started using personalized recommendations. Source: (Instapage, n.d.)
Healthcare : Predicting and Preventing Health Problems
By identifying health risks early, doctors can provide better care and help patients stay healthier in the long run. This approach not only improves outcomes but also lowers healthcare costs by preventing serious issues before they arise (Cleveland, n.d.)
Hospitals are using data analytics to improve patient care. By reviewing data such as past checkups, test results, and medical histories, doctors can now identify patients who may be at risk for serious health problems.
This allows them to take preventive actions before conditions become emergencies. For example, hospitals like the Cleveland Clinic are using these methods, which have helped reduce emergency room visits and improve overall patient health.
This line chart shows how emergency visits went down steadily over a
year as doctors used predictive tools. Source: (ScienceDirect, n.d.)
Supply Chain: Delivering the Right Products at the Right Time
Companies like Amazon and Flipkart use real-time data to manage their supply chains effectively. Amazon employs machine learning and AI to predict demand, optimize inventory, and adjust delivery routes in real time, ensuring timely deliveries. Similarly, Flipkart utilizes real-time inventory tracking and analytics to manage stock levels and fulfill orders efficiently.
By monitoring product availability, delivery statuses, and potential delays, these companies can prevent overstocking, reduce late deliveries, and enhance customer satisfaction. This data-driven approach allows them to act swiftly and make informed decisions, ultimately saving time and money (WarelQ, 2025)
This bar chart shows improvements in inventory accuracy and delivery performance after using data-based planning. Source: (OptimoRoute, n.d.)
Finance: Stopping Fraud Before It Happens
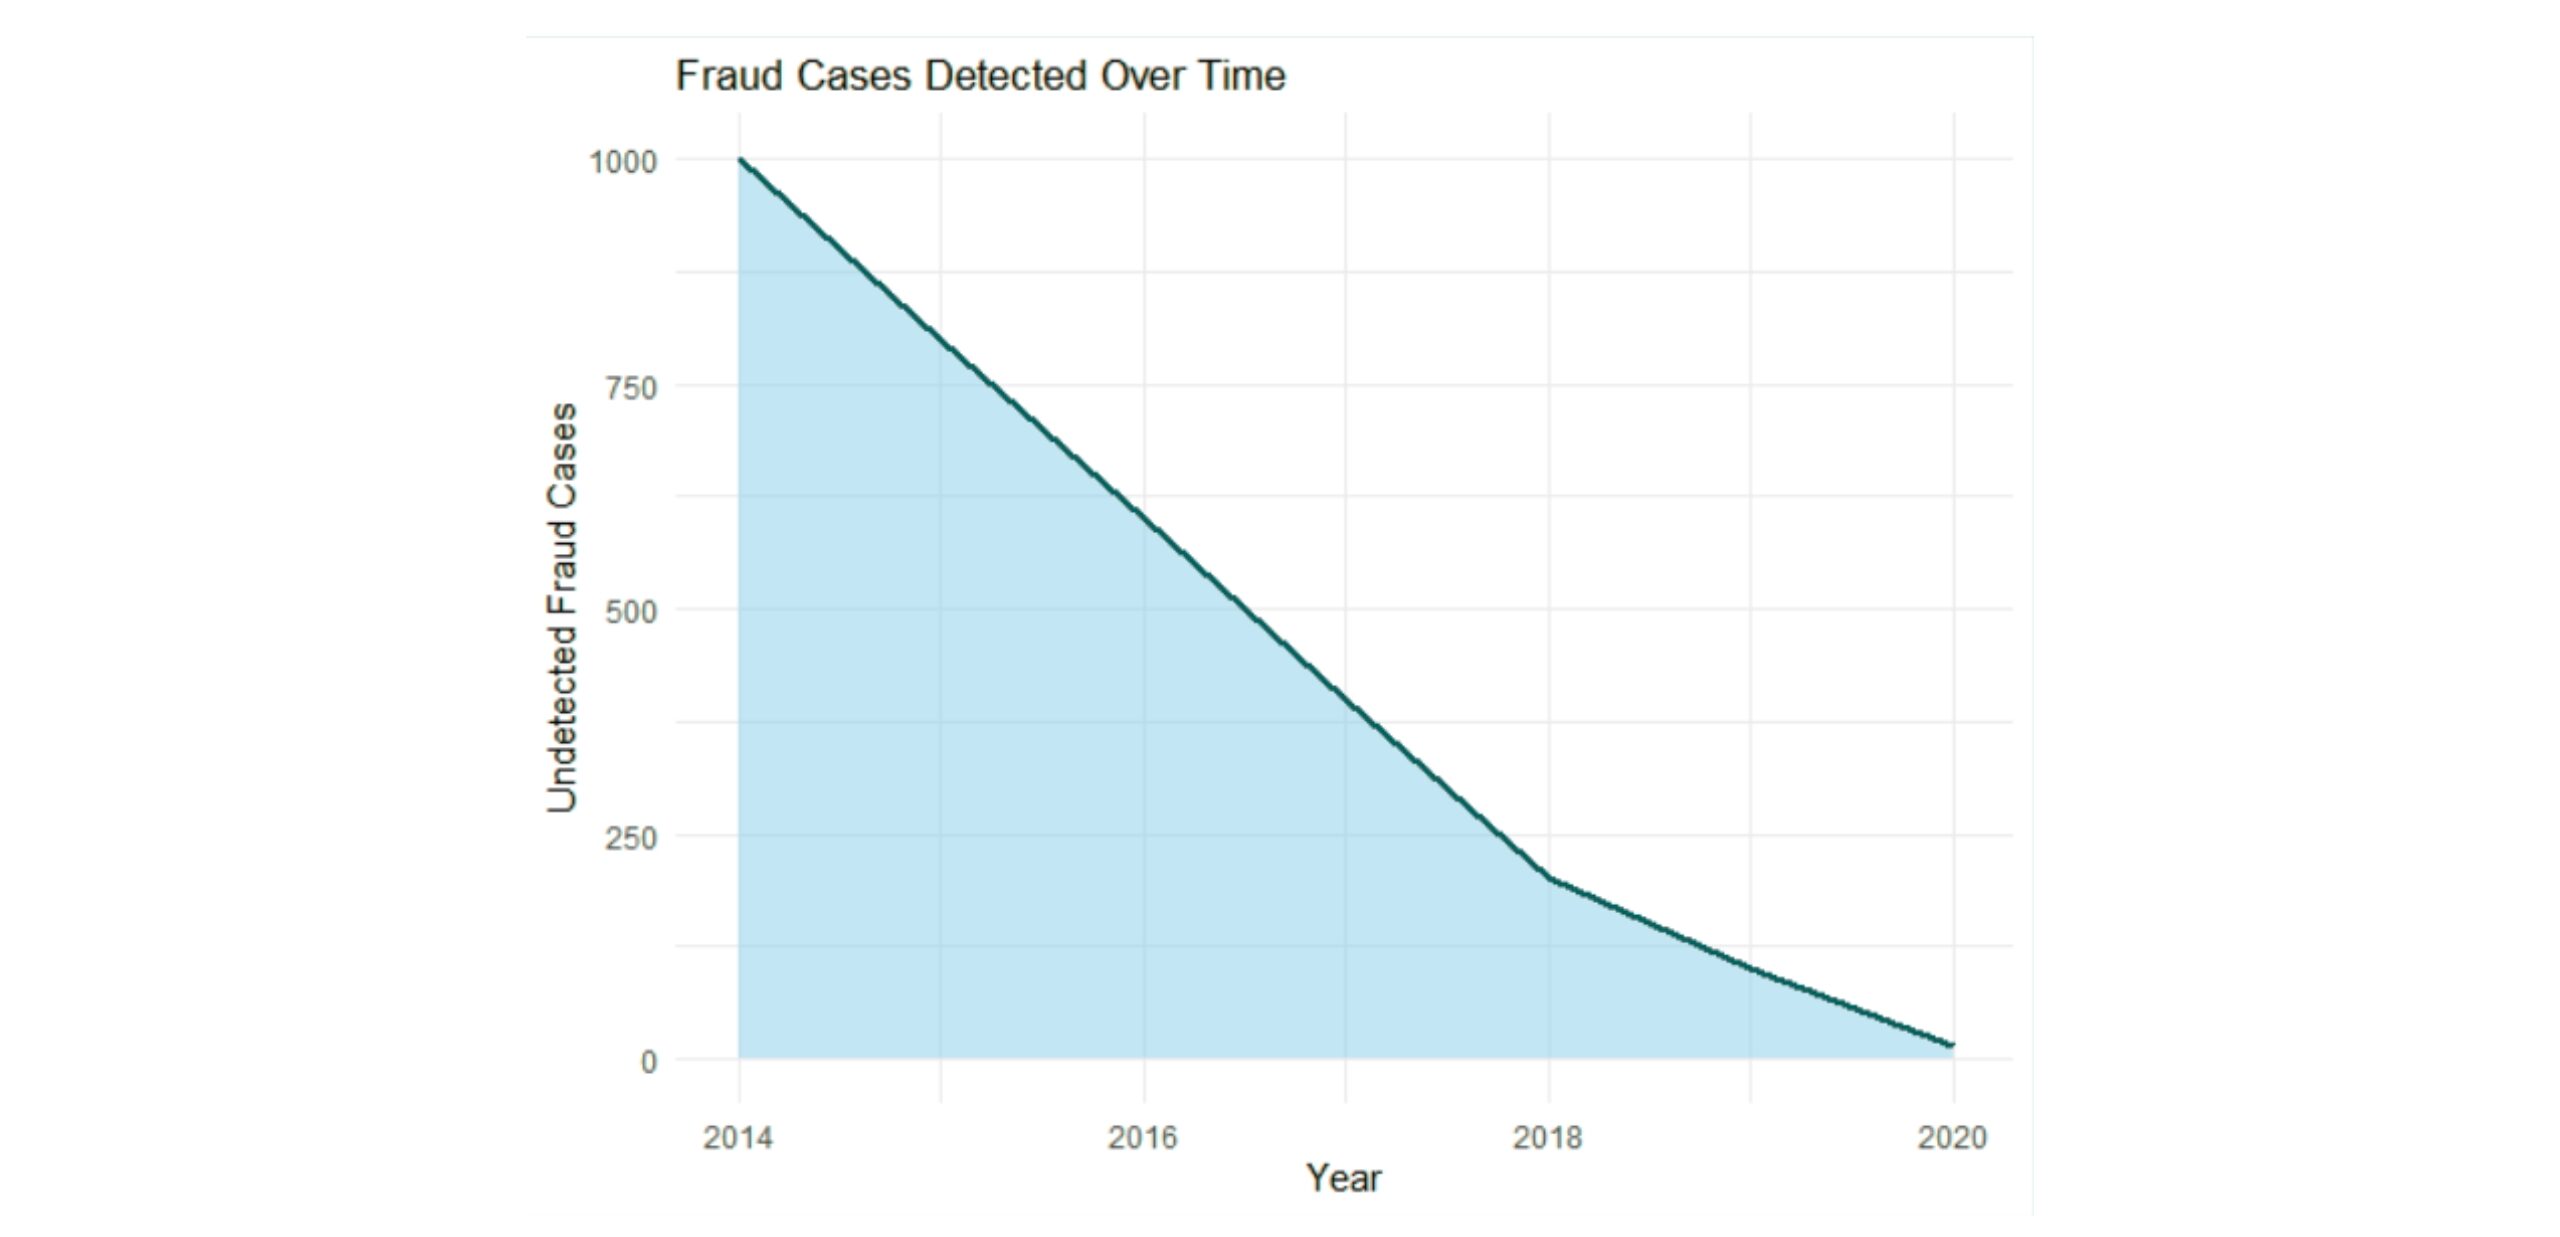
Banks and payment apps like Paytm and PhonePe use data to protect their users from fraud. By tracking how customers usually spend their money, these systems can spot any unusual activity quickly, such as a sudden purchase in another country. When this happens, the system can block the transaction or alert the customer almost instantly. This helps prevent financial losses and keeps users’ accounts safe. By using data in this way these companies save millions and build trust with their customers. This approach not only stops fraud in its tracks but also ensures a safer experience for users when making payments online (Paytm, n.d.)
This area chart shows a big drop in undetected fraud as banks adopted better data tools. Source: (FICO, n.d.)
What Makes Analytics Work: People, Tools, and Teamwork
Data becomes valuable only when everyone in the organization knows how to use it effectively. This requires training employees, investing in the right tools, and ensuring that all departments, from marketing to finance, are working with the same data.
Companies also focus on improving collaboration among teams to share insights and results.By making data accessible and ensuring that everyone is on the same page, businesses can make better decisions and work more efficiently.
Building a culture of data-sharing helps create a more connected organization, where teams can work together to solve problems and drive success (Harward, n.d.)
TThis horizontal bar chart shows the top areas companies invest in when building a strong data culture. Source: (Deloitte, 2023).
How Analytics Leads to Real Business Benefits
Using data wisely isn’t just about efficiency— it helps companies grow. According to McKinsey, businesses that use analytics well are more likely to increase their revenue, make quicker decisions, and better understand their customers. This leads to stronger customer relationships and more repeat business.
These companies can also react faster to changes in the market, giving them an edge over their competitors.Instead of guessing, they rely on facts to guide their actions. Over time, this approach helps them become more flexible, reduce risks, and improve overall performance.In short, smart use of data leads to real business results (QuantumBlack, n.d.)
Conclusion
Today, using data the right way is one of the most powerful tools a business can have. It helps companies understand what their customers want, improve the way they work, and avoid costly mistakes. Whether it’s a store recommending the right product or a hospital spotting early signs of illness, data makes decisions smarter. It turns simple numbers into helpful actions. But collecting data isn’t enough success comes from using it wisely. Businesses that build strong teams, use the right tools, and share insights across departments are the ones making real progress. They move faster, adjust to change more easily, and stay ahead of the competition. The future belongs to those who can turn data into clear, confident decisions.
Good Data, Good Decisions
Build Smarter, Stronger Organizations.
References
- Cleveland, n.d. Cleveland Clinic on Predictive Healthcare.
- Deloitte, 2023. Digital Investments and Regional Priorities.
- FICO, n.d. Investor Relations.
- Harward, B. R., n.d. Harvard Business Review on Building a Data-Driven Culture.
- Harward, B. S., n.d. 4 Types of Data Analytics to Improve Decision-Making.
- IBM, n.d. Analytics tools and solutions.
- IBM, n.d. Descriptive, Predictive & Prescriptive Analytics.
- Instapage, n.d. Personalization Statistics.
- OptimoRoute, n.d. Inventory Accuracy.
- Paytm, n.d. Paytm Security Features.
- QuantumBlack, 2016. The age of analytics: Competing in a data-driven world.
- QuantumBlack, n.d. The data-driven enterprise of 2025.
- ScienceDirect, n.d. The effect of predictive analytics-driven interventions on healthcare utilization
- Shopify, n.d. McKinsey on Personalization in Retail.
- Statista, 2024. Amount of data created, consumed, and stored 2010-2023, with forecasts to 2028.
- WarelQ, 2025. Flipkart’s Regional Inventory Shift: What Sellers Need to Know.