


How to Avoid Costly Error in Data-Driven Decision Making (D3M)
Share Now:
In today’s world where everything is becoming digital, companies are using data more and more to make smart choices about what to do.This way of making decisions, called datadriven decision-making (D3M), helps them understand what’s happening, guess what might happen next, and make their plans better. But, just using data isn’t always easy, and there are some common mistakes that can make it not work so well.

It’s important to know what these mistakes are and how to avoid them so that the decisions companies make are based on good information. This article will talk about some of the usual problems with using data to make decisions and give some ideas on how to deal with them Data-Driven Decision Making (D3M) empowers organizations to base their strategies on evidence rather than intuition.
By analyzing real data, businesses can gain a deeper understanding of their operations, customer behavior, and market trends.This approach leads to more informed choices in areas like marketing, customer experience enhancement, and operational efficiency. Ultimately, D3M fosters a data-centric culture, making decision-making more objective, quantifiable, and impactful.

Chhavi Tyagi
Data Analyst
What is Data-Driven Decision-Making (D3M)

Data-Driven Decision Making (D3M) is the strategic practice of using data to inform and support business choices. Rather than relying on intuition, assumptions, or guesswork, D3M emphasizes the analysis of concrete data to uncover insights about what’s happening and why. From optimizing marketing strategies and enhancing customer experiences to improving operational efficiency, datadriven decisions empower organizations to act with greater clarity and confidence. By placing data at the core of planning and problem-solving, D3M fosters a culture of objectivity, accountability, and continuous improvement—ultimately leading to more effective, measurable, and impactful outcomes.
Relying on flawed or incomplete data

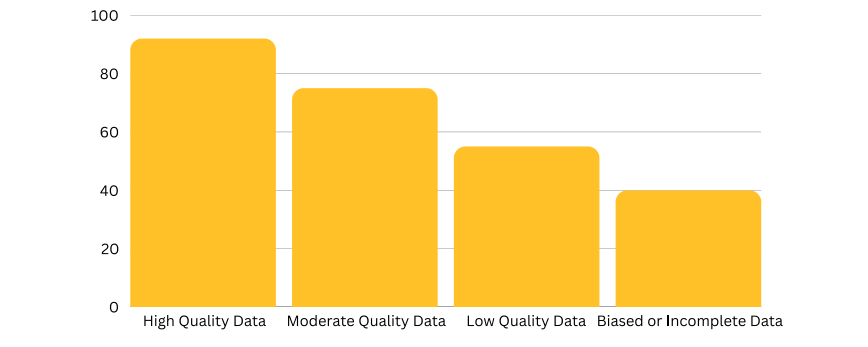
One common mistake is using data that has problems or isn’t complete. Like the saying goes, “garbage in, garbage out” – and this is very true when looking at data. If the data that’s gathered is unfair, not correct, or doesn’t really show who you’re interested in, then any decisions you make based on it will probably be wrong. “For instance, a seemingly high accuracy in a predictive model built on flawed data can still lead to poor real-world outcomes (Provost, 2013)”.
If a company plans an advertising campaign using information about customers that isn’t up to date, the campaign probably won’t do well, and they’ll waste money and miss chances. To stop this big mistake from happening, companies need to spend time making sure they collect data well, use careful ways to clean up and check the data to find and fix mistakes, “and really think about where their data comes from and what its limits are (Provost, 2013)”.
Confusing Correlation with Causation
Another common and often costly mistake is misinterpreting correlation as causation. Simply observing that two variables move together does not inherently mean that one causes the other. The classic example of ice cream sales increasing alongside crime rates in summer perfectly illustrates this fallacy; both are likely influenced by a confounding third factor, such as warmer weather leading to more people being outside. Acting on a perceived causal link in such scenarios can lead to ineffective or even counterproductive decisions, allocating resources based on a spurious relationship.
To avoid this trap, a thorough understanding of the underlying mechanisms and the application of “techniques like controlled experiments or sophisticated causal inference methods are crucial to establish genuine causal links before making strategic decisions (Pearl, 2018)”. It’s a frequent error to assume that because two variables correlate, one causes the other. This misinterpretation can lead to misguided strategies based on false causal relationships. To avoid it, always seek to establish causation through rigorous experimental designs or advanced statistical methods before making decisions. Recognize that correlation alone doesn’t imply causation.
Correlation vs. Causation Example
Graph: A scatter plot showing a strong correlation between two variables (e.g., ice cream sales and drowning incidents).

Data Quality and Objectivity
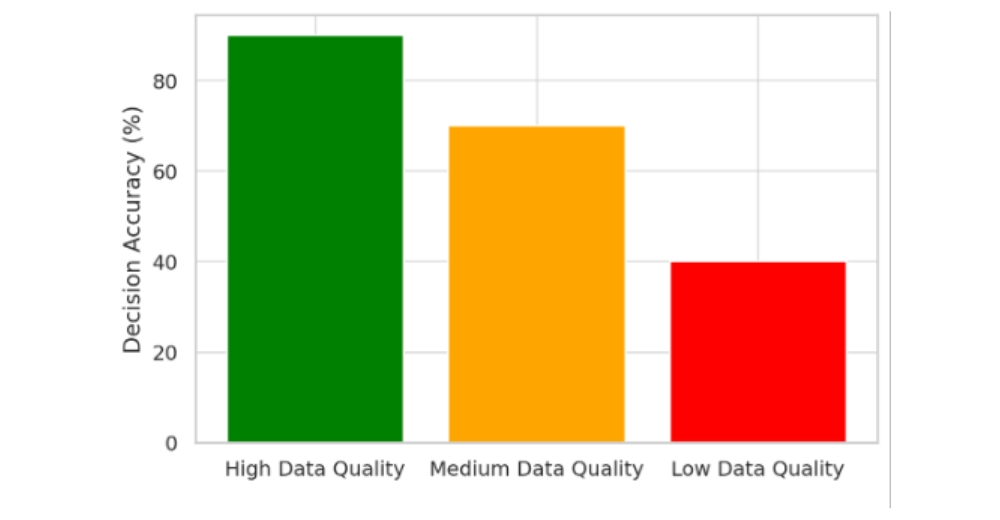
Making choices based on data that’s wrong, not complete, unfair, or old can lead to really bad decisions. If the data isn’t good, then any ideas you get from it won’t be trustworthy. Also, something called “confirmation bias” can cause problems. This is when people naturally prefer information that already agrees with what they think. So, people looking at data might focus on the parts that support their first ideas and ignore anything that doesn’t, which gives a wrong picture of the data. To avoid these connected problems, companies need to have strong rules about how they handle data. This includes checking the data often and cleaning it up to make sure it’s correct, reliable, and not biased. Plus, it’s important to encourage people to be open-minded, listen to different viewpoints, and sometimes “analyze data without knowing what the expected outcome is. This can help make sure the data is looked at fairly and without bias (Nickerson, 1998)”.
Graph: A bar chart comparing the accuracy of decisions made with high-quality vs. poor-quality data.
Insight: Organizations with high data accuracy make better strategic decisions.
Reference: FullStory (fullstory.com) (FullStory, 2024)
Ignoring Sample Size Significance
Small Sample Sizes Can Mislead, using small or non-representative samples can lead to inaccurate conclusions that don’t reflect the broader population. These samples often lack the power to detect real patterns, resulting in flawed strategies. For example, surveying only 10 people about a city’s preferences may give a skewed view compared to surveying 1,000 diverse residents. Always use a large and representative sample to ensure results are reliable and meaningful.
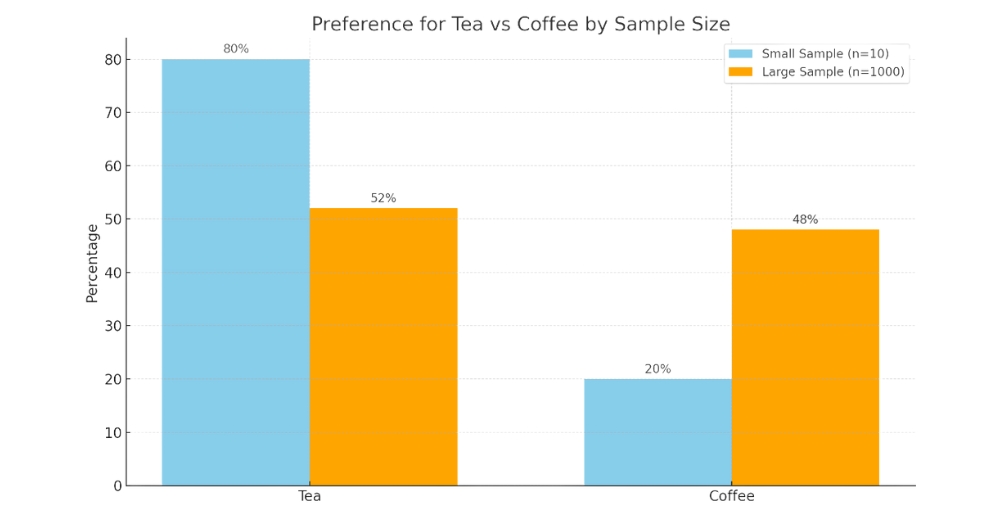
It shows how the preference percentages for tea and coffee shift between a small and large sample size—highlighting how results can vary dramatically with sample size.
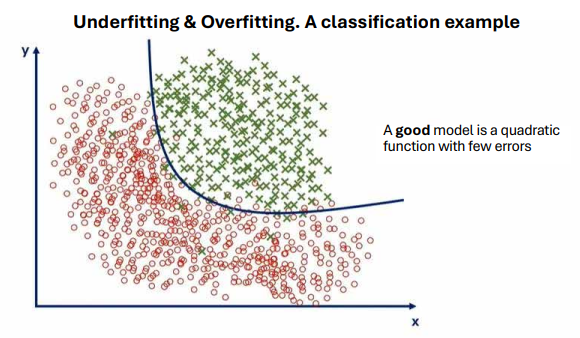
Overfitting Of the Models
Real-Life Example - Overfitting Housing

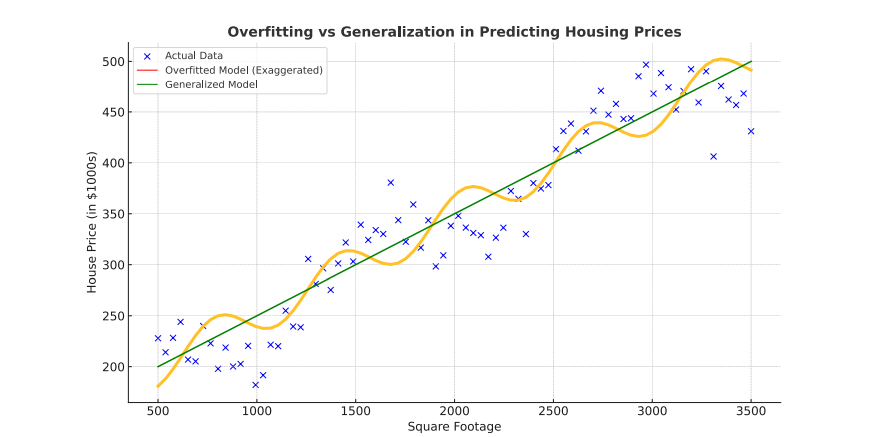
Imagine a real estate company building a model to predict house prices based on features like square footage, number of bedrooms, and location. If they overfit the model using a small dataset (e.g., 100 houses), it might learn not just the true patterns, but also the random quirks—like one unusually expensive house with a pink mailbox.
- Overfitted Model: Fits the training data perfectly, even outliers.
- Generalized Model: Captures the main trends and performs better on unseen houses.
Neglecting Data Governance and Privacy

Neglecting data governance and privacy can cause serious issues for organizations. Without clear rules, companies may violate regulations like GDPR or CCPA, leading to heavy fines and legal trouble. Weak security systems leave data vulnerable to breaches, which damage customer trust and reputation. Poor governance also results in inconsistent or inaccurate data, leading to bad decisions. Employees without proper training may mishandle information, increasing the risk of leaks or non-compliance.
Lack of access controls can allow unauthorized people to misusesensitive data. All of this can hurt a company financially and socially. To prevent these problems, businesses must create strong data policies, train staff, and stay updated on privacy laws.Protecting data isn’t optionalit’s essential for long-term success and customer loyalty.
Effective Communication of Data Insights

Finally, even the most insightful data analysis can be rendered useless if the findings are not communicated effectively to stakeholders. If decision-makers don’t understand the key findings, their practical implications, or the underlying reasoning behind the recommendations, they are unlikely to adopt them or take appropriate action.
Therefore, the ability to translate complex data insights into clear and concise visualizations, develop compelling narratives that resonate with the audience, and “tailor the communication style to the specific level of understanding of the intended recipients are essential skills for successfully translating data insights into impactful and actionable decisions (Few, 2012)”.
Conclusion

In conclusion, while data offers immense and transformative potential for improving organizational decision-making, it is absolutely crucial to be acutely aware of the common pitfalls that can easily derail the process and lead to suboptimal outcomes. By proactively focusing on ensuring high data quality, developing a deep understanding of the nuances of statistical relationships (distinguishing correlation from causation), diligently avoiding overfitting statistical models, actively mitigating cognitive biases that can skew interpretation, and prioritizing clear and effective communication of findings, organizations can truly harness the power of their data to make more informed, strategic, and ultimately more impactful decisions, driving sustainable growth and success.
References
Good Data, Good Decisions
Build Smarter, Stronger Organizations.
Chhavi Tyagi
Data Analyst
What is Data-Driven Decision-Making (D3M)
Data-Driven Decision Making (D3M) is the strategic practice of using data to inform and support business choices. Rather than relying on intuition, assumptions, or guesswork, D3M emphasizes the analysis of concrete data to uncover insights about what’s happening and why. From optimizing marketing strategies and enhancing customer experiences to improving operational efficiency, datadriven decisions empower organizations to act with greater clarity and confidence. By placing data at the core of planning and problem-solving, D3M fosters a culture of objectivity, accountability, and continuous improvement—ultimately leading to more effective, measurable, and impactful outcomes.

Relying on flawed or incomplete data

One common mistake is using data that has problems or isn’t complete. Like the saying goes, “garbage in, garbage out” – and this is very true when looking at data. If the data that’s gathered is unfair, not correct, or doesn’t really show who you’re interested in, then any decisions you make based on it will probably be wrong. “For instance, a seemingly high accuracy in a predictive model built on flawed data can still lead to poor real-world outcomes (Provost, 2013)”.
If a company plans an advertising campaign using information about customers that isn’t up to date, the campaign probably won’t do well, and they’ll waste money and miss chances. To stop this big mistake from happening, companies need to spend time making sure they collect data well, use careful ways to clean up and check the data to find and fix mistakes, “and really think about where their data comes from and what its limits are (Provost, 2013)”.
Confusing Correlation with Causation
Another common and often costly mistake is misinterpreting correlation as causation. Simply observing that two variables move together does not inherently mean that one causes the other. The classic example of ice cream sales increasing alongside crime rates in summer perfectly illustrates this fallacy; both are likely influenced by a confounding third factor, such as warmer weather leading to more people being outside. Acting on a perceived causal link in such scenarios can lead to ineffective or even counterproductive decisions, allocating resources based on a spurious relationship.
To avoid this trap, a thorough understanding of the underlying mechanisms and the application of “techniques like controlled experiments or sophisticated causal inference methods are crucial to establish genuine causal links before making strategic decisions (Pearl, 2018)”. It’s a frequent error to assume that because two variables correlate, one causes the other. This misinterpretation can lead to misguided strategies based on false causal relationships. To avoid it, always seek to establish causation through rigorous experimental designs or advanced statistical methods before making decisions. Recognize
that correlation alone doesn’t imply causation.
Correlation vs. Causation Example
Graph: A scatter plot showing a strong correlation between two variables (e.g., ice cream sales and drowning incidents).
Data Quality and Objectivity
Making choices based on data that’s wrong, not complete, unfair, or old can lead to really bad decisions. If the data isn’t good, then any ideas you get from it won’t be trustworthy. Also, something called “confirmation bias” can cause problems. This is when people naturally prefer information that already agrees with what they think. So, people looking at data might focus on the parts that support their first ideas and ignore anything that doesn’t, which gives a wrong picture of the data. To avoid these connected problems, companies need to have strong rules about how they handle data. This includes checking the data often and cleaning it up to make sure it’s correct, reliable, and not biased. Plus, it’s important to encourage people to be open-minded, listen to different viewpoints, and sometimes “analyze data without knowing what the expected outcome is. This can help make sure the data is looked at fairly and without bias (Nickerson, 1998)”.
Ignoring Sample Size Significance
Small Sample Sizes Can Mislead, using small or non-representative samples can lead to inaccurate conclusions that don’t reflect the broader population. These samples often lack the power to detect real patterns, resulting in flawed strategies. For example, surveying only 10 people about a city’s preferences may give a skewed view compared to surveying 1,000 diverse residents. Always use a large and representative sample to ensure results are reliable and meaningful.
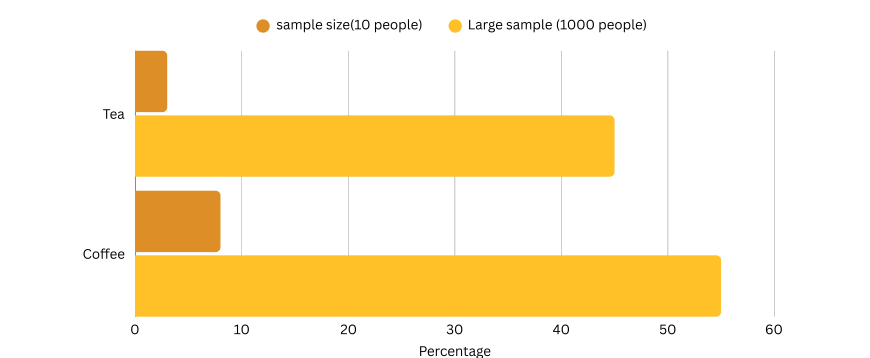
It shows how the preference percentages for tea and coffee shift between a small and large sample size—highlighting how results can vary dramatically with sample size.
Overfitting Of the Models
Furthermore, organizations often fall into the trap of overfitting their models. This occurs when a statistical or machine learning model learns the noise and random fluctuations in the training data too well, leading to excellent performance on the training dataset but poor generalization to new, unseen data. This results in overly optimistic predictions and a model that fails to perform effectively in realworld applications. Employing techniques like cross-validation to assess out-of-sample performance, applying regularization methods to penalize model complexity, and maintaining a healthy skepticism towards overly complex models that perfectly fit the training data are “crucial strategies to mitigate the risk of overfitting and ensure the model’s practical utility.” (Hastie, T., Tibshirani, R., & Friedman, J., 2009) Real-Life Example: Overfitting in Predicting Housing Prices
Real-Life Example - Overfitting Housing
 Imagine a real estate company building a model to predict house prices based on features like square footage, number of bedrooms, and location. If they overfit the model using a small dataset (e.g., 100 houses), it might learn not just the true patterns, but also the random quirks—like one unusually expensive house with a pink mailbox.
- Overfitted Model: Fits the training data perfectly, even outliers.
- Generalized Model: Captures the main trends and performs better on unseen houses.
Neglecting Data Governance and Privacy
Neglecting data governance and privacy can cause serious issues for organizations. Without clear rules, companies may violate regulations like GDPR or CCPA, leading to heavy fines and legal trouble. Weak security systems leave data vulnerable to breaches, which damage customer trust and reputation. Poor governance also results in inconsistent or inaccurate data, leading to bad decisions. Employees without proper training may mishandle information, increasing the risk of leaks or non-compliance.
Lack of access controls can allow unauthorized people to misusesensitive data. All of this can hurt a company financially and socially. To prevent these problems, businesses must create strong data policies, train staff, and stay updated on privacy laws.Protecting data isn’t optionalit’s essential for long-term success and customer loyalty.
Neglecting Data Governance and Privacy

Finally, even the most insightful data analysis can be rendered useless if the findings are not communicated effectively to stakeholders. If decision-makers don’t understand the key findings, their practical implications, or the underlying reasoning behind the recommendations, they are unlikely to adopt them or take appropriate action.
Therefore, the ability to translate complex data insights into clear and concise visualizations, develop compelling narratives that resonate with the audience, and “tailor the communication style to the specific level of understanding of the intended recipients are essential skills for successfully translating data insights into impactful and actionable decisions (Few, 2012)”.
Conclusion
In conclusion, while data offers immense and transformative potential for improving organizational decision-making, it is absolutely crucial to be acutely aware of the common pitfalls that can easily derail the process and lead to suboptimal outcomes. By proactively focusing on ensuring high data quality, developing a deep understanding of the nuances of statistical relationships (distinguishing correlation from causation), diligently avoiding overfitting statistical models, actively mitigating cognitive biases that can skew interpretation, and prioritizing clear and effective communication of findings, organizations can truly harness the power of their data to make more informed, strategic, and ultimately more impactful decisions, driving sustainable growth and success.

Good Data, Good Decisions
Build Smarter, Stronger Organizations.